Title of Editorial in the Wall Street Journal, January 25, 2026
Winter Storm Fern hit hard during January 23-27, affecting more than 200 million people, and knocking out power to more than a million customers, primarily across the south. While this was an improvement over Storm Uri in 2021 when 5 million customers were hit with blackouts, Fern still represented a significant challenge to the resilience of the electric grid.
Energy Information Administration (EIA) data show that on January 25, coal power plants supplied 30% more electricity than they had a week earlier, and natural gas-fired power plants generated 14% more. Output from wind farms and solar panels was lower when the winter storm peaked.[1] According to EIA, “Grid operators can call upon the coal fleet to increase electricity generation in extreme weather events and other times when demand surges or output falls from other generation sources …”[2]
Energy Ventures Analysis (EVA) analyzed the performance of different electricity generators in the most heavily impacted regions of the country: Southwest Power Pool (SPP); Midcontinent Independent System Operator (MISO); PJM Interconnection (PJM); New York Independent System Operator (NYISO); New England Independent System Operator (NE-ISO); and the Southeast. EVA’s analysis found that −
- The coal fleet performed well during Fern (hence the WSJ headline above).
- Natural gas also made an important contribution.
- Wind underperformed compared to other winter storms.
- Solar also underperformed because of cloud cover and ice-covered panels.
The following is a very brief summary of the performance of the coal fleet in five of these regions (NYISO and NE-ISO have no coal-fired generation) based on capacity factors, which is one of several ways to assess performance (or reliability) when electricity is needed the most. Capacity factor is the amount of energy that an electricity source actually generates compared to what it would generate if it operated at its theoretical maximum. To meet the greater demand for electricity during extreme weather, power sources must be able to run harder, which means increasing their capacity factors. EVA used EIA data to compare capacity factors during the first two weeks of January and during Fern, when more electricity was needed. Nuclear power is not included in this blog because nuclear plants usually run at or close to their maximum capacity factors regardless of weather.
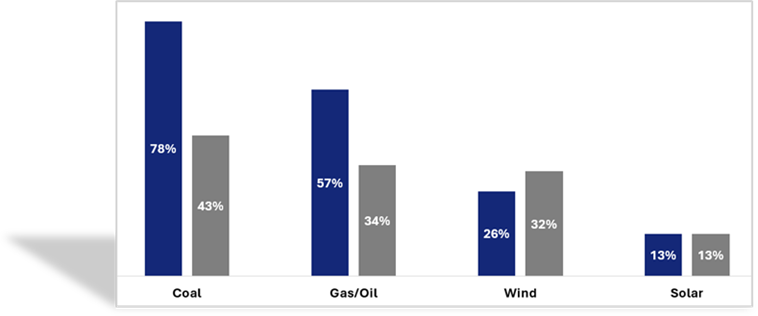
Average capacity factors across the five regions that have coal power plants –
- The capacity factor for the coal fleet increased from 43% to 78%.
- Natural gas increased from 34% to 57%.
- Wind declined from 32% to 26%.
- Solar did not change.
The graph below compares these capacity factors during Fern (blue) and before Fern (grey).
The following summarizes the capacity factors for each of the five regions:
SPP capacity factors –
- The coal fleet capacity factor more than doubled from 43% to 90%.
- Natural gas increased from 22% to 38%.
- Wind declined from 42% to 30%.
- Solar declined from 16% to 7%.
ERCOT capacity factors –
- The coal fleet capacity factor increased from 46% to 80%.
- Natural gas increased from 33% to 75%.
- Wind declined from 35% to 24%.
- Solar declined from 19% to 11%.
MISO capacity factors –
- The coal fleet capacity factor increased from 50% to 67%.
- Natural gas increased from 39% to 50%.
- Wind increased from 39% to 54%.
- Solar increased from 11% to 18%.
PJM capacity factors –
- The coal fleet capacity factor increased from 51% to 81%.
- Natural gas/oil increased from 43% to 62%.
- Wind declined from 44% to 21%.
- Solar increased from 9% to 15%.
Southeast capacity factors (this region includes all or parts of southeastern states that are not in MISO or PJM) –
- The coal fleet capacity factor almost doubled from 37% to 71%.
- Natural gas/oil increased from 32% to 59%.
- Wind was negligible before and after Fern.
- Solar increased from 13% to 16%.
The Wall Street Journal could just as easily have said “thank heaven for coal, natural gas, and nuclear power.” The lackluster performance of wind and solar power in many regions during extreme weather again shows why the grid must continue to rely on the most dependable sources of electricity, especially coal power plants.
[1] Energy Information Administration, “Coal-fired generation rose to meet demand during Winter Storm Fern,” January 28, 2026.
[2] Ibid.